“The XPS Research Institute” (501c3)
XPS Methods, Protocols, and Standards
Why do we use XPS?
Our principal reason to use XPS is to identify the elements, chemical states, electronic states, and atom %s of the elements contained in the surface of a material.
XPS has many Applications!
However, over the past 50 years,
we XPS users have found Problems with our XPS data
that now require our Time to rejuvenate and enhance the Reliability of XPS.
What are those Problems?
-
-
-
-
- reference BEs having large uncertainty errors from pure chemicals,
- various calibration energies for Ag, Au, and Cu, still being used
- different energy scale lengths due to different calibration energies,
- uncertainty errors in C (1s) BE due to varying thickness of adventitious carbon,
- 1 eV range of charge referencing (correction) BEs based on hydrocarbon moieties in adventitious carbon,
- insufficient or irregular charge compensation (control), sample bottom semi-insulating,
- peak-fitting that uses abnormal parameters, large FWHM, too many peaks,
- atom %s with large uncertainties, +/-20% or more
- use of different IMFPs for atom % calculations,
- use of empirical sensitivity factors
-
-
-
What are Our Mutual Goals?
To improve the reliability of new experimentally measured XPS data by working together to produce:
-
-
-
-
- improved charge referencing,
- improved charge compensation methods,
- more accurate atom % quantitation,
- more reliable reference BEs (from pure materials),
- better peak-fitting (less bad peak-fitting),
- more reliable chemical state assignments,
- improved reliability of BEs published in future literature, books, and databases
-
-
-
Who will work together to develop these improvements?
-
-
-
-
- XPS scientists,
- academic professors,
- manufacturing engineers,
- applications scientists,
- industrial engineers,
- university graduate students,
- XPS instrument designers,
- XPS experts
-
-
-
How do we reach Our goals?
- by working in our spare time,
- by working in small teams,
- international round-robin testing,
- define experiments to measure current results,
- design and test new data collection protocols,
- design and test new data processing protocols,
- test capabilities of our internal XPS processing software,
- purchase sheets of polymers for round-robins,
- purchase inexpensive single crystals for round-robins,
- purchase chemical compounds with sequential oxidation states,
- test simple insulating device to enhance charge control and referencing,
- develop new method for energy scale calibration using only Copper (Cu) metal
Our team effort is now taking Flight
A Groundbreaking Effort to Improve
the Reliability of
XPS BEs, Atom %s, and Chemical State Assignments
Contact Us, your new Team Mates!
The XPS Research Institute Inc.
501c3, Non-Profit, Educational
Located: 1091 Vineyard View Way S, Salem, Oregon, 97306, USA
E-mail: bvcrist@xpslibrary.com, bvcrist@xpsresearch.com
Cell in USA: -1-650-919-3940

Surfaces: 2024
Surfaces of solids can vary from smooth to rough. The information obtained from a surface depends on the energy (1486 eV, 8.3 ang), elements in the surface, and tilt angle of the sample. For monochromatic Aluminum X-rays the depth of information can range from 5 ang (0.5 nm) to 120 ang (~12 nm). When Chromium X-rays (5414 eV, 2.30 ang) are used the maximum depth of information can be as great as 350 ang (35 nm). When monochromatic Gallium X-rays (9250 eV, 1.34 ang) are used the maximum depth of information can be as great as 500 ang (50 nm).

Copied from ScientaOmicron website.
Wolfgang Pauli once stated:
“The surface was invented by the Devil.”
Maybe he anticipated the troubles caused by surface charging!
There are two major types of charging: Surface Charging and Bulk Charging, XPS has to deal with surface charging effects.
“Charging” exists at the surface of a non-conductive sample when a low voltage (1-10 eV) beam of electrons is used to flood onto the surface to modify the charge that exists on the surface of the sample while it is simultaneously irradiated with a beam of monochromatic X-rays.

XPS BEs are Not (Very) Reliable
WHY?

XPS Atom %s are Not (Very) Accurate
WHY?

Our Claim is:
XPS BEs in NIST Database and Most Academic Publications are Not (very) Reliable.
Our Question to all XPS Scientists is:
Do you Agree?
Are most published chemical state assignments
Reliable or indeed Not Very Reliable?
If you agree that they are not very reliable,
then what will you do with your next set of peak-fitted XPS BEs?
XPS produces two (2) fundamental types of data from the Surface.
BEs and Atom %s
After 50 years of using XPS, we still have trouble with BEs and Atom %s.
This is a bad situation. We look like we are lazy or not capable.
If a Native Oxide exists in its’ Thermodynamically Stable form then,
WHY does a Comparison of BEs show Large Differences?

Will we work together to improve XPS results in the near future?
To start, E-mail: bvcrist@xpsresearch.com
Causes of these BE Problems

If you agree, then the Features & Causes of the Binding Energy (BE) Problems (Our Problems) are:
- More than 80% of all samples are insulators that require charge compensation and charge referencing
- Roughly 90% of journal publications are produced by university professors and their poorly trained students
- A few XPS facilities use experienced XPS scientists to maintain an XPS instrument and help tens of students
- Eighty percent (80%) of BEs in NIST database are from Wagner’s collection of BEs collected from 1970-1990 by university students.
- BEs were and are still collected by university students who receive only a few days training from the last instrument operator
- Histograms of pure elements listed in Wagner’s (NIST) database show large dispersion and high standard deviations. BEs vary by +/- 0.4 eV
- Histograms of insulators listed in Wagner’s (NIST) database show large dispersion and large standard deviations. BEs vary by +/- 1.2 eV
- Wagner’s BEs are the same BEs that are published in NIST database, PHI handbooks, Seah’s handbook and others.
- Thousands of authors trust and use Wagner’s BEs because they are published in US NIST database and PHI handbooks.
- This means almost everyone is using Wagner’s collection of BE have large standard deviations
- Thousands of authors trust and used Wagner’s BEs because they are published in NIST database and PHI handbooks.
- From 1970 to 1990 BE Calibration was based mainly on BE of Ag (3d5) and Au (4f7). Cu (2p3) BE was almost never reported.
- Only 1 or 2 low BE calibration values from Ag or Au are reported in journals in today’s publication
- Many publications list the “expected” reference calibration BEs in a publication, they do not report “measured” calibration BEs
- Cu (2p3) BE (932.6 eV): A calibration energy appears at high BE end is almost never reported. Degrades BEs > 600 eV.
- Energy Scale ranges depended on preference of instrument makers until 2005.
- The Cu (2p3) BE varies by >0.6 eV (932.2 to 932.8 eV) between different instruments.
- The Cu (2p3) BE setting causes the energy scale to stretch and to vary significantly above 600 eV; errors increase at higher and higher BE
- Authors do not check Energy scale calibration values on same date as data to be published
- Instrument operators usually do not measure or report the energy scale BEs on a weekly basis to produce a trend (run) chart
- Chemical State assignments are based on old unreliable NIST BEs and old literature assignments also based on unreliable NIST BEs
- Journal reviewers do not require sufficient calibration and description of instrument parameters from authors
- Operation and Effects of Flood Gun is seldom documented by the instrument makers
- Optimizing the quality of charge compensation by adjusting XYZ and voltage is seldom attempted
- Charge Referencing is still based on the C (1s) hydrocarbon peak of adventitious carbon
- Charge Compensation (control) is still poorly understood and is a form of magic.
- When flood gun is used on various native oxides (AlOx, BeOx, MgOx, SiOx) then C (1s) BE is biased”
- BE of C (1s) hydrocarbon peak is known to vary based on the amount (thickness) of the adventitious carbon layer
- C (1s) BE depends on the dielectric nature of the surface.
- C (1s) BE for adventitious hydrocarbon has been reported to appear from 284.2 eV to 285.2 eV.
- C (1s) BE on noble metals varies from 284.2 to 284.6 eV.
- C (1s) BE on thin, conductive native oxides vary from 284.2 to 286.3 eV
- The C (1s) of adventitious hydrocarbons was reported as 284.6 eV from 1976 to 1992.
- Most XPS scientists still use C(1s) BE of adventitious hydrocarbons for charge referencing
- PHI’s new handbook reports 284.8 eV, a 0.2 eV increase without support evidence or justification.
- ISO, VAMAS, and ASTM do not yet define the C (1s) BE for adventitious hydrocarbon, which is used for charge referencing
- Current standards bodies (ISO, VAMAS, ASTM…) do not and can not enforce their documentary standards
- Peak-fitting results are not reliable because most peak-fit parameters are allowed to vary with no valid basis.
- FWHM values are seldom, if ever, based on known FWHM and have no basis for use.
- Quantitative atom% results are not reliable because data analysts (processors) use various methods to integrate peak areas, different end-points, different, sensitivity factors, and different IMFP correction factors.
- When empirical formula or atom% results are published there is no proof that Transmission Function is valid.
- Surface depth of 5-10 nm may not be homogeneous.
Journal Publications Document the Problem with Unreliable BEs
- 1980 – R.J. Bird, P. Swift, J. Electron. Spectrosc. 21 (1980) 227.
- 1982 – P. Swift, Surf. Interface Anal. 4 (1982) 47.
- 1984 – D.M. Hercules, J.C. Klein, C.P. Li, J.F. Black, Appl. Spectrosc. 38 (1984) 29.
- 1984 – S. Kohiki, Appl. Surf. Sci. 17 (1984) 497.
- 1984 – S. Kohiki, K. Oki, J. Electron Spectrosc. 33 (1984) 375.
- 1990 – C. J. Powell, and M. P. Seah, Journal of Vacuum Science & Technology A 8, 735 (1990). (Rev on Precision and Accuracy).
- 1996 – B. Vincent Crist, J. Surface Analysis (Japan), Vol. 2, 21-58 (1996). A Critical Review of Popular XPS Data-banks
- 1997 – B. Vincent Crist, XPS International Web Site. XPS International LLC, California, USA, https://www.xpsdata.com, (Accessed 17.05.24).
- 1999 – B. Vincent Crist, IUVSTA World Experts on XPS St. Malo,, France, April 17 (1999).
- 2004 – B. Vincent Crist, XPS International Web Site. XPS International LLC, California, USA, https://www.xpsdata.com, (accessed 24.01.24).
- 2018 – B. Vincent Crist, The XPS Library Web Site. XPS International LLC, California, USA, https://www.xpslibrary.com (accessed 25.01.24)
- 2019 – B. Vincent. Crist, J. Electron Spectrosc. Relat. Phenom. 231 (2019) 75. XPS in Industry – Problems with binding energies in databases
- 2020 – G. Greczynski, L. Hultman, Progress, Mater. Sci. 107 (2020) 100591.
- 2021 – G. Greczynski, L. Hultman, Sci Rep. 11 (2021) 11195.
- 2021 – G. Greczynski, L. Hultman, Applied Surface Science 542 (2021) 148599.
- 2021 – G. Greczynski & L. Hultman, Scientific Reports | (2021) 11:11195.
- 2022 – G. Greczynski, L. Hultman, J. Appl. Phys. 132 (2022) 011101.
- 2022 – G. Greczynski, L. Hultman, Vacuum. 205 (2022) 111463.
- 2023 – G. Greczynski et al., Sci. Adv. 9, eadi 3192 (2023).
- 2023 – G. H. Major et al, J. Vac. Sci. Technol. A 41(3) May/Jun 2023.
Examples of XPS BE Problems
NIST Reference BEs are Useful ONLY as a Guide
because they are Not (very) Reliable
WHY? Large Std. Dev. in NIST BEs are due to large ranges in BEs which decrease reliability of “Mean BE”
Std. Dev. for Conductor Metals in Periodic Table below
| Acceptable Range for Std. Dev. | 0.10 | to | 0.30 |
| Poor Range for Std. Dev. | 0.31 | to | 0.60 |
| Un-reliable Range for Std. Dev. | >0.61 | ||
Insulators Represent >80% of All Materials Analyzed
Uncertainty in BEs for Insulators in NIST BEs is >0.8 eV
Uncertainty in BEs for Metals in NIST BEs is >0.4 eV

Insulators have Std. Dev. ranging from 0.30 to 1.9 (outliers: LiI, KCl, Sc)
NIST Reference BEs are Useful as a Guide, but are Not (very) Reliable
Compare BEs in rows 1 and 2 from the
XI SpecMaster Database to the NIST Mean BEs

Histograms reveal Why NIST BEs are Unreliable Histograms reveal Why NIST BEs are Unreliable
Our problems are deeply rooted in old journal papers and NIST database.
Ranges for Std. Dev. in Periodic Table
| Acceptable Range for Std. Dev. | 0.10 | to | 0.30 |
| Poor Un-reliable Range for Std. Dev. | 0.31 | to | 0.60 |
| Very Un-reliable Range for Std. Dev. | >0.61 |
Histogram for Ag metal (3d5) Calibration BE in
NIST SRD 20 Database of BEs

Histogram for SnO, mono-oxide, (Sn 3d5) Reference BE in
NIST SRD 20 Database of BEs

Histogram for Ti metal (Ti 2p3) Reference BE in
NIST SRD 20 Database of BEs

Histogram for Zn metal (Zn 2p3) Reference BE in
NIST SRD 20 Database of BEs

Histogram for Zr metal (Zr 3d) Reference BE in
NIST SRD 20 Database of BEs

Our problems are deeply rooted in old journal papers and NIST database.
Ranges for Std. Dev. in Periodic Table
| Acceptable Range for Std. Dev. | 0.10 | to | 0.30 |
| Un-reliable Poor Range for Std. Dev. | 0.31 | to | 0.60 |
| Very Un-reliable Range for Std. Dev. | >0.61 |
Histogram for Cu metal (2p3) Calibration BE in
NIST SRD 20 Database of BEs

Histogram for SnO2, di-oxide, (Sn 3d5) Reference BE in
NIST SRD 20 Database of BEs

Histogram for TiO2 (Ti 2p) Reference BE in
NIST SRD 20 Database of BEs

Histogram for ZnO (Zn 2p3) Reference BE in
NIST SRD 20 Database of BEs

Histogram for ZrO2 (Zr 3d) Reference BE in
NIST SRD 20 Database of BEs

High Res XPS Resolves Chemical Shifts as Small as 0.12 eV
This overlay of almost identical AuCu alloys Proves It.


Chemical State Assignments based on NIST BEs are Unreliable


Our XRI Team of experienced XPS instrument operators and scientists develop new methods and protocols for everyone to use.
An International Team of XPS Scientists and Trouble-shooters
XRI calls on and relies on expert XPS scientist, engineers, and analysts with many years of experience on XPS Instruments from all makers: Kratos, PHI, Scienta, Specs, and Thermo who analyze the difficult samples: insulators, rough surfaces, high dielectrics, powders, and non-conductive fibers.
The XPS Research Institute (non-profit, 501c3, for education)


Our Corporate Sponsors

XRI Products and services
Discover What XRI Members Do and How We Do It
And then join the XRI team and work with your fellow team members to invent and develop reliable solutions to one of Many Problems in XPS Information.
Surface Charging
Uncontrolled Charging
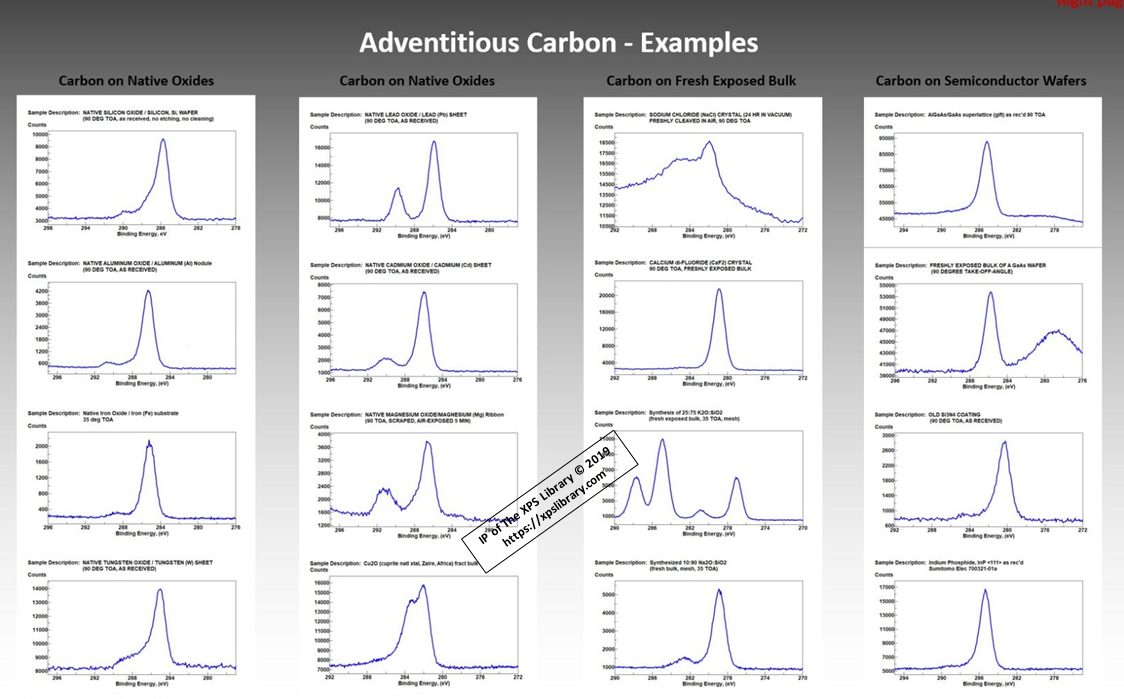
Adventitious Carbon
Improve Charge Referencing

BEs for Cu (2p3)
NIST BEs NOT Reliable
Greetings! Wie Gehts! Saludos! Salvete! Salutations! Konnichiwa! Insamal! Hälsningar! Privet! Vær hilset!
Our international team of application engineers, demo engineers, instrument managers, QC/QA people, XPS scientists, dedicated professors and everyone who are responsible to produce reliable information from raw XPS spectra, are very much appreciated for using your valuable time to improve XPS assignments and advance material science and product engineering.

XRI Develops Practical, Real-World Tables of
Practical XPS Reference Data
XRI will produce an App that can be used while using your XPS or Synchrotron Beamline
A Periodic Table with BEs of Metals, Common Oxides, and FWHMs

A Table of Peak FWHM to assist Peak-fitting
